
Voter turnout in the two most recent elections in Toronto reached historic lows. In the provincial election on June 2, 2022, the turnout was 48.2%, the lowest ever recorded for a provincial election. In the municipal election on October 24, 2022, the turnout was 29%, another lowest rate ever. So what’s going on here? Is it simple voter apathy, that the electorate is disengaged with politics? Or is there something else going on?
As is often the case, the answer is nuanced. Turnout was down, but it wasn’t down uniformly across candidates. Voters for incumbents came out, but voters for the other candidates stayed home. I was a campaign manager for both elections in the riding of Don Valley West/ Ward 15, and one of the key reasons that electors stayed home they didn’t feel like their voted mattered.
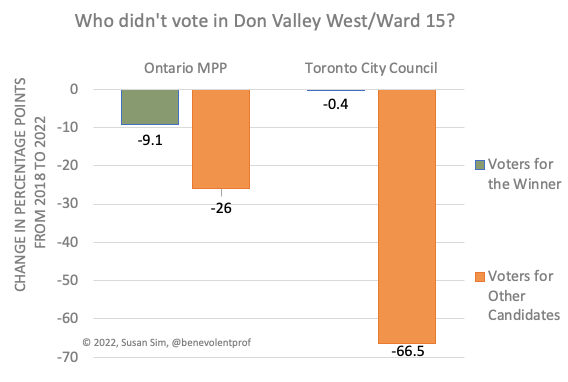
The graph shows the change from 2018 to 2022 in percentage points of voters for winners vs. voters for the other candidates. For the provincial election, there was a change in candidate, but the incumbent party won. In the municipal election, the incumbent candidate also won.
This decline suggests a certain fatalism among voters for non-winners. Since March 2020, we have been in survival mode. Isolation, social and physical distancing, uncertainty, and anxiety have affected our mental health. We are not sleeping well, are less patient with each other, doom scrolling through social media, binging on videos, and have less capacity for empathy. On the campaign trail, we found that people were tired, worn out by the worry of living through pandemic. Asking them to engage in big issues, such as decarbonization and disability benefit rates, was a lot when they were trying to get through the day. These electors just didn’t have in them to show up on election day and vote for a candidate who was probably going to lose.
It would be inaccurate to say that electors didn’t care. While canvassing, people definitely had their issues, such as funding for health and education, unwanted high rises in Leaside, and an unwanted rail yard in Thorncliffe Park. In the provincial election, we heard from people that would be voting strategically. They wanted their vote to make a difference in the outcome.
Now it’s your turn. Did you stay home on election day? What was your situation?
Data
Results of 2018 Provincial Election
| Candidate | Party | Votes | Percentage |
|---|---|---|---|
| Kathleen Wynne | Liberal | 17,802 | 38.89 |
| Jon Kieran | Progressive Conservative | 17,621 | 38.49 |
| Amara Possian | New Democratic | 8,620 | 18.83 |
| Morgan Bailey | Green | 1,268 | 2.77 |
| John Kittredge | Libertarian | 380 | 0.83 |
| Patrick Geoffrey Knight | Canadian Economic | 86 | 0.19 |
Results of 2022 Provincial Election
| Candidate | Party | Votes | Percentage |
|---|---|---|---|
| Stephanie Bowman | Liberal | 16,177 | 49.91 |
| Mark Saunders | Progressive Conservative | 14,208 | 43.84 |
| Irwin Elman | New Democratic | 3,392 | 10.47 |
| Green | Sheena Sharp | 2,025 | 6.25 |
| Laurel Hobbs | New Blue | 421 | 1.29 |
| John Kittredge | Libertarian | 225 | 0.69 |
| Kylie Mc Allister | Ontario Party | 167 | 0.51 |
| John Kladitis | Independent | 85 | 0.26 |
| Paul Reddick | Consensus Ontario | 60 | 0.19 |
Results of 2018 Municipal Election
| Candidate | Votes | Percentage |
|---|---|---|
| Jaye Robinson (incumbent) | 16,219 | 49.22% |
| Jon Burnside (incumbent) | 14,440 | 43.82% |
| Tanweer Khan | 1,309 | 3.97% |
| Nikola Streker | 583 | 1.77% |
| Minh Le | 404 | 1.23% |